Objectified Analytics
Executive-grade analytics across every API, schema, and team in your tenant.
Analytics turns operational telemetry into board-room narratives. Track adoption of every endpoint, the health of every schema, and the velocity of every team — then schedule beautiful, branded reports straight to stakeholder inboxes.
What ships with Analytics
Every Analytics surface is wired into the rest of the Objectified platform — no glue code, no separate identity, no bolt-on integrations.
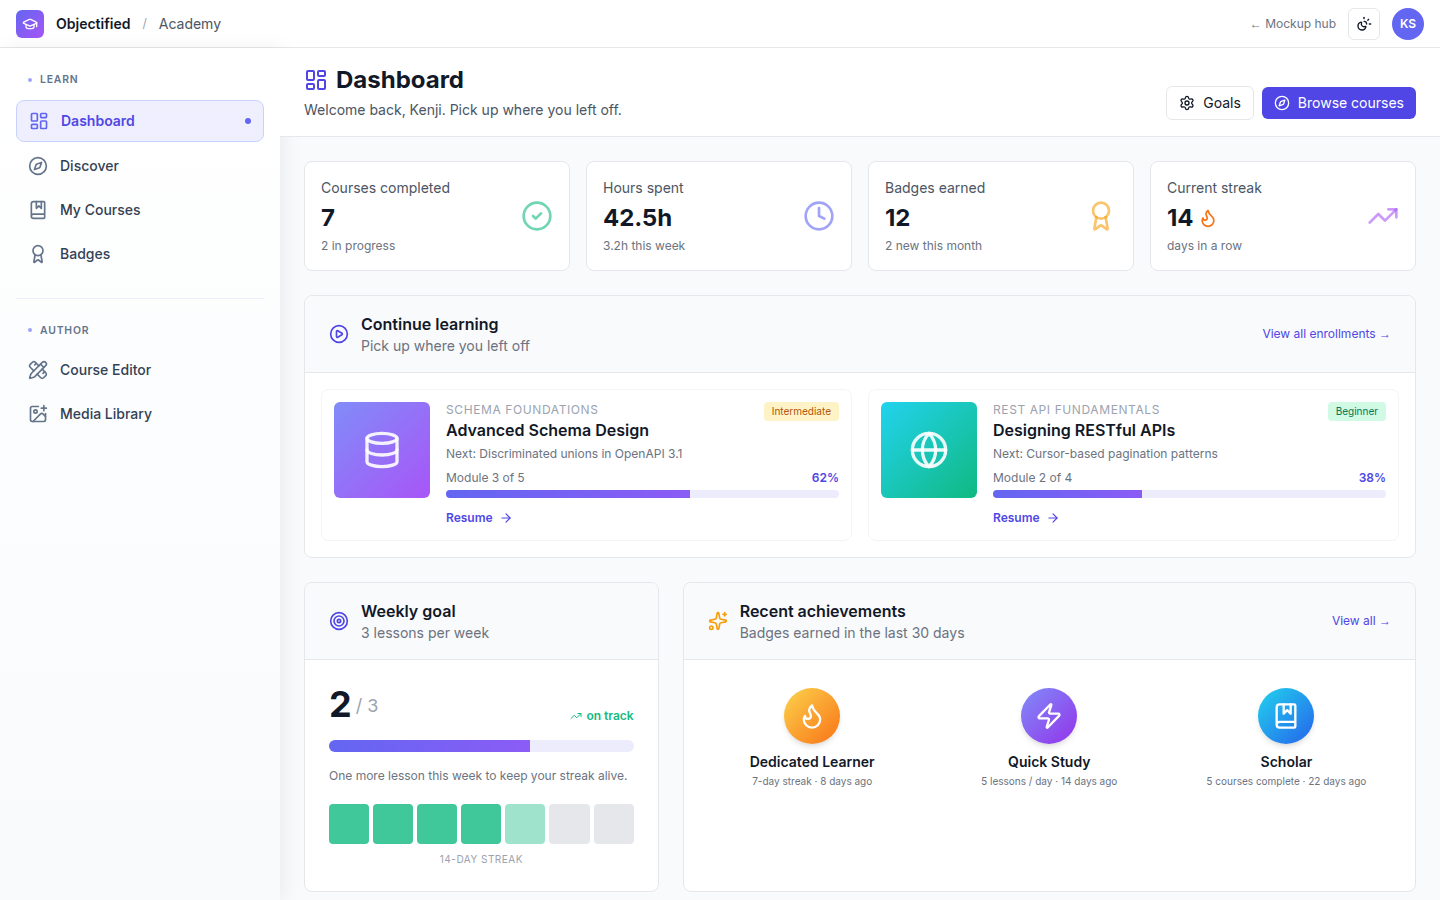
Executive dashboard
Curated KPIs for adoption, quality, velocity, and cost across the whole tenant.
API analytics
Per-endpoint volume, latency, error class, and consumer cohort breakdowns.
Schema analytics
Field-level usage, drift signals, and unused-property detection.
Team analytics
Velocity, review throughput, and quality-trend indices per team and product.
Export center
Schedule branded PDFs, CSV exports, and dashboards to people, channels, or storage.
Custom reports
Drag-and-drop report builder with templates for QBRs and board reviews.
A look inside Objectified Analytics
Live design previews from the Analytics mockup pack — 5 surfaces in total.

Per-endpoint adoption, latency, error-rate, and consumer breakdown.

Schema usage heatmaps with property-level reach and drift.

Export center with scheduled PDF, CSV, and dashboard delivery.

The full Analytics surface map — all 5 screens linked from a single hub.
Use cases
Analytics is designed around the way real teams actually work — not the way a tool wants them to work.
Run a Monday morning health review without opening 10 tabs.
Prove which endpoints actually move the metric you care about.
Tie API consumption directly to billing & revenue events.
- Row-level security across every metric and dimension
- SOC 2 / HIPAA compliant data warehouse residency
- SLA-backed real-time roll-ups and 13-month retention
- BI connectors for Looker, Tableau, Power BI, and Snowflake share
- Anomaly alerting with PagerDuty / Opsgenie / webhook routing
- Natural-language query bar over every metric and dimension
- Automated weekly insight digests with anomaly call-outs
- AI-suggested KPIs based on tenant usage patterns
- Forecasts with confidence bands for adoption and cost
Ask your data anything
Natural-language analytics turn questions like “which endpoints regressed this week?” into instantly rendered dashboards with citations to the underlying events.
Every Analytics AI feature is grounded in your tenant's data, runs under your data-residency policy, and respects every role and ACL the platform enforces.
Every surface in Objectified Analytics
A look at the 5 screens designed for this suite — covering everything from day-1 onboarding to day-100 operations.